
Executive Summary
The objective of U.S. Vote Foundation’s 2024 Voter Experience Survey was to continue our inquiry into the ways in which Americans cast their ballots at home and abroad, to examine which election processes went well and which could be improved, and to learn more about the experience of voting in the 2024 General Election. This report is one of a series analyzing post-election survey responses.
There were 12,061 responses to this survey, which ran from November 5, 2024 through December 2, 2024. In addition to demographic questions, survey participants answered questions about how they voted, their level of satisfaction with the voting process, and whether problems arose. Respondents were also asked for their opinions on voter reform and US politics. Their responses are analyzed and presented here.
Summary of Survey Highlights
- One in ten voters reported that they were disenfranchised. The primary reason for this was that their ballot did not arrive in time for them to complete and return it by their state’s deadline. Three-quarters of those who could not vote were overseas voters.
- Nearly two-thirds (65.8%) of Overseas Absentee Voters received their ballots more than four weeks before Election Day.
- All categories of voters had a high interest in U.S. politics.
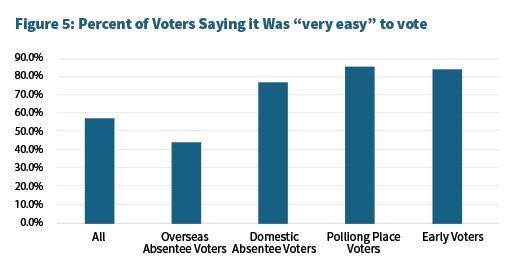
- Just over forty percent (42.4%) of Overseas Absentee Voters said it was “very easy” to vote, compared to 73.9% of Domestic Absentee Voters.
- The majority of Overseas Absentee Voters returned their ballots via postal mail (58.6%).
- 72.6% of all voters expressed concern about potential interference in the U.S. 2024 General Election by other countries.
- There was broad support for several reform measures, including affording all U.S. citizens born abroad the right to vote, and granting Overseas Absentee Voters permanent absentee voter status. Support for internet or email voting was varied, with both Domestic Absentee and Overseas Absentee Voters holding higher support than those who voted in person.
Introduction
U.S. Vote Foundation and its Overseas Vote initiative launched the 2024 Voter Experience Survey on Election Day, November 5, 2024. Email invitations were sent to those on the U.S. Vote Foundation mailing list on November 5, with a reminder sent several days later, and a second reminder sent one week later. The Association of Americans Resident Overseas (AARO) shared the survey to its mailing list as well. The survey ran through December 2, 2024. A total of 12,061 individuals responded.
Respondents were grouped into five categories based on the methods they used to cast their ballots: Overseas Absentee Voters, Domestic Absentee Voters, those who voted Early in Person (Early Voters); those who voted at a polling place on Election Day (Polling Place Voters) and Non-Voters.
Of those who indicated their means of voting, more than half, 56.8% (6786 respondents) responded that they had cast their ballot via Overseas Absentee Ballot; 1268 (10.6%) had cast a ballot early in person; 1275 (10.7%) had cast a vote via Domestic Absentee Ballot; 1125 (9.4%) voted at their polling place on Election Day as registered voters. Over ten percent (1279; 10.7%) were not able to cast a ballot (see Table 1).

Demographics
All 50 of the United States were represented among respondents. New York, California, Texas, Florida and Ohio were the most-represented states (see Table 2).

With respect to racial identity (see Table 3), the highest percentages of white respondents were Domestic Absentee and Overseas Absentee Voters, the highest percentages of Hispanic or Latino respondents were Non-Voters and Domestic Absentee Voters, and the highest percentage of Black or African American respondents were Early Voters.

With respect to gender (see Figure 1), women were represented at higher percentages than other voters across all voter types.

With respect to education (see Table 4), voters with some college, as well as those holding a college or post-graduate degree were represented at higher percentages than other voters across all voter types.
In contrast to Polling Place voters, Domestic Absentee Voters, and Early Voters, nearly half of Overseas Absentee Voter respondents (48.4%) reported having a postgraduate or professional degree. This finding is also consistent with U.S. Vote Foundation’s previous voter survey research.

Absentee voters, both overseas and domestic, skewed older than those who voted in person, whether early or at their polling place (see Table 5). Voters who are 65 or older made up over forty percent of absentee voters, while accounting for only a third of all other voter types, including Non-Voters.

With respect to employment status (see Table 6), the highest percentage of full-time student respondents were Non-Voters (5.3%), and the highest percentage of self-employed respondents were Overseas Absentee Voters (13.7%). Respondents with full-time employment were more likely to be Polling Place Voters, (42.0%) and the respondents with part-time employment were more likely to be Domestic Absentee Voters (7%).

Demographics Specific to Overseas Absentee Voters
In a finding consistent with previous research, the greatest percentage of Overseas Absentee Voter respondents have lived abroad for long periods of time (see Table 7), with more than three-quarters having lived abroad more than 10 years, and 40.0% percent having lived abroad for more than 25 years.

The countries most-represented among Overseas Absentee Voter respondents were Canada, Germany and the United Kingdom (see Table 8). This is consistent with previous research. Though Mexico is among the top countries of residence for American citizens living outside the United States, Mexico ranked twelfth at 2.3% for Overseas Absentee Voting. Poor infrastructure and inadequate postal systems may hamper participation from voters in Mexico.

The top ten states in which Overseas Absentee Voter survey respondents cast ballots comprise a range of red, blue and purple states (see Table 9). The 2024 presidential race in a some of these states, for example Pennsylvania and Michigan, were decided by margins of less than 2%.

Voter Satisfaction
There were substantial differences in satisfaction reported across the different methods of voting (see Figure 2).
- Overseas Absentee Voters were considerably less satisfied than those voting domestically.
- Polling Place Voters were the most satisfied with their voting experience, with 87.2% indicating they were “very satisfied” or “satisfied,” as compared with Overseas Absentee Voters, among whom only 72.4% indicated satisfaction.
- Unsurprisingly, Non-Voters indicate a very low level of satisfaction (11.1%) with their voting experience.

Voters gave some indications about the source of their dissatisfaction. One Domestic Absentee Voter noted:
“Did not know that I have to request a ballot to be mailed every time. Was not clear at first where to request the mail ballot.”
An Overseas Absentee voter who had lived overseas more than 25 years noted the complexity of the process:
“All the steps (printing, signing, scanning, sending by email, sending the paper copy by ordinary mail) are a hassle, but I'm an old hand.”
And indeed, voter satisfaction increased among Overseas Voters with time spent abroad, from 66.2% satisfaction of those living abroad less than one year, to 86.6% of those living abroad 25 years or more.
A non-voter from overseas echoed many others when they said:
“Couldn't find a way to mail my ballot from the country I am currently in.”
Voter satisfaction did not appear to differ across racial identity, levels of education or gender.
Challenges to Voting and Where Voters Sought Help
The challenges around voting were too much for over 10 percent (10.7%) of respondents, who did not cast a ballot (see Table 1). Less than one percent (0.6%) said they had never planned to vote, while ten percent said they had intended to do so, meaning that one in 10 voters who wanted to vote were unable to do so.
Overseas Absentee Voters reported challenges at a higher rate than other voter types. Of those who did not cast a ballot, 75.5% had intended to cast an Overseas Absentee Ballot (see Figure 3). Of those, nearly two-thirds (63.3%) had lived outside the US more than 10 years, or at least two presidential cycles, suggesting that even those familiar with the procedures still experience problems in voting. More than 12 percent of those indicating that they live abroad were unable to vote.
Domestically, Polling Place Voters also faced challenges, as this person noted:
“All record of my registration was gone at my habitual polling place, as if I had never existed. I was told I wasn't able to vote.”

Receipt and Return of Ballot
Requesting a Ballot
Overseas Absentee Voters
Among those requesting an overseas absentee ballot, the problem most often mentioned (see Table 10) was accessing the form and/or instructions (8.3%). There were many different challenges; one voter reported that it took more than 25 emails to finally receive their ballot. Ballots that were accessed via website often required voters to provide an access code and comply with other security measures, The advantages of receiving ballots online were often outweighed by a lack of both access to the proper equipment and the technical acuity required to access and print the voting material.

Many other problems were noted as well, including the purging of voter rolls in some states, as this Florida voter noted:
“…..my previous vote by mail registration in 2023 [was wiped out], and [the same happened] to others in my family and friends group. … [They were] quiet about the registrations being wiped out to make vote by mail harder.”
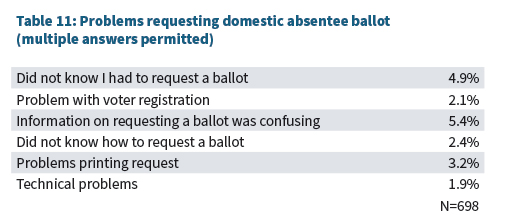
Nearly five percent of Domestic Absentee Voters reported not knowing that they had to request a ballot (see Table 11), which suggests there is room for improvement in awareness-raising and voter outreach. Over five percent also noted that the information on how to request a ballot is “complicated.”
Receiving a Ballot
Domestic Absentee Voter respondents did not report any notable issues with ballot receipt.
Overseas Absentee Voters, on the other hand, indicated problems receiving their ballots, with paper size and printing problems predominating (see Table 12).

The 8 ½ x 11-inch paper that is ubiquitous in the U.S. is used only in Canada, the Philippines and in some places in Central and South America. It is not used in Europe, elsewhere in Asia or in Africa. Respondents spoke of the difficulties they had resizing a ballot to print out on A4 paper:
“2 hours fiddling with the origami of the vote papers and adjusting the printer to US paper size!”
“I had to outsmart the printer.”
Nearly 90 percent (88.6%) of Domestic Absentee Voters received their ballots in the U.S. postal mail, and another 7.2% received their ballots via email (see Table 13).

In contrast, over two-thirds (69.3%) of Overseas Absentee Voter respondents received their ballots via email, and nearly twenty percent (19.0%) received their ballots via postal mail. Respondents noted technical issues with both of these methods. The 2009 Military and Overseas Voter Empowerment (MOVE) Act requires states to offer the option of sending overseas ballots to voters via electronic means. In light of the slow postal mail systems in some countries, sending ballots electronically is, in theory a quicker process, though it is not one that comes without complications.
Some older voters noted the challenges: [caps original to comment]:
“I'M 75 YOA [years of age] AND NO COMPUTER WIZZ.”
Nearly two-thirds (65.8%) of Overseas Absentee Voters received their ballots more than four weeks before Election Day. As mandated by the MOVE Act, ballots must be ready to send to overseas voters as of 45 days before Election Day. This is meant to account for the fact that in many countries, including the U.S., postal systems can be slow. Nevertheless, nearly seven percent (6.9%) of overseas absentee voters received their ballots less than two weeks before Election Day.
A slightly higher percentage of Domestic Absentee Voters (8.8%) received their ballots less than two weeks before the election (see Figure 4). This does not represent a problem in terms of the mail system, but from a practical perspective, it is a very short window in which to vote and return a ballot, especially if it is being mailed from an out-of-state address. Many domestic absentee voters are traveling or at school, or temporarily posted away from their voting residence address.

Voting or Returning a Ballot
Requesting and receiving the ballot are just the first two steps in the process of absentee voting. Returning the voted ballot is the next step, and it is not always straightforward. Only 42.4% of Overseas Absentee Voters indicated that it was “very easy” to vote, compared to 73.9% of Domestic Absentee Voters, 81.0% of Early In-Person Voters and 81.9% of Polling Place Voters (see Figure 5).
Of Early Voters, 95.8% said it was very easy or easy to find their voting location (80.9% reporting “very easy,” 14.9% “easy”). For Polling Place voters, 95.5% said it was very easy or easy to find their voting location (82.4% reporting “very easy,” 13.1% “easy”).
While 84.1% of Overseas Absentee Voters noted that the voting instructions were easy to follow, this was still notably fewer than the 99.8% of both domestic Polling Place and Early Voters who indicated that this was the case for them (see Figure 6).

Respondents were asked how they returned their ballots. Just 2.8% of Domestic Absentee Voter respondents used email, while nearly one in five (16.7%) of Overseas Absentee Voter respondents did so.
In 28 states, electronic return of ballots is permitted for overseas and military voters; in 22 states, voters must return a paper ballot. This includes some of the states in which the largest numbers of overseas voters cast their ballots: New York, Ohio and Pennsylvania. Postal mail remains a fundamental ballot return method (see Tables 14 and 15).


After returning their ballots, roughly half of Domestic Absentee Voter respondents (51.4%) and half of Overseas Absentee Voter respondents (50.9%) checked the status of their ballots online.
While some overseas voters noted the expense of mailing ballots by priority mail or via courier such as FedEx, DHL, etc., others relied on the U.S. Embassy diplomatic pouch for ballot return:
“As an overseas voter, the physical mailing in of the ballot made it extremely difficult to vote. I live about 2 hours from the embassy so it takes a lot of time/time off work, and money to travel to submit my ballot.”
Respondents were, on the whole, confident that their votes would be counted in the 2024 election (see Figure 8). Nearly half of all respondents (47.2%) were extremely confident that their votes would be counted, with Early Voters the most confident (at 62.0%), even more so than Polling Place Voters (57.6%). The lowest confidence emerged among Overseas Absentee Voters, just under half (45.7%) of whom indicated high confidence.

Seeking Help
Poll workers and election officials hold the top role for helping domestic voters, while less so for overseas voters. The majority of domestic Polling Place Voters who sought help (93.8%) did so from a poll worker or election official, as did the majority of Early Voters (88.3%). Overseas Absentee Voters reached out for help to election officials less often (16.5%), but additionally sought help from the U.S. Vote Foundation Help Desk (7.5%), or reached out to friends or family for help (6.5%).
Non-Voters
Late receipt of an absentee ballot was the primary issue preventing would-be voters from voting (see Table 16). Nearly half of Non-Voters (44.5%) indicated a late-arriving or non-arriving ballot as their reason for not voting. One person who had attempted to vote via domestic absentee ballot noted:
“It took too long to get my ballot and the state says they still haven’t received [my request for] it despite me mailing well in advance.”
As for Overseas Absentee Voters, those who have successfully voted in previous elections may not understand that they are required to file a new Federal Post Card Application (Voter Registration/Ballot Request) form each election year in which they wish to vote. Failure to resubmit the form means they will not receive a ballot.
Overseas Absentee Voters who have successfully submitted their Voter Registration/Ballot Request form have the option, in the case of non-receipt of ballot, of voting by Federal Write-In Absentee Ballot (FWAB). Just over four percent (4.4%) of Overseas Absentee Voter respondents did so.

An Overseas Absentee Voter in Canada who was unsure whether their ballot had been counted, explained what voting from abroad can be like when it doesn’t go according to expectations:
“I (finally) was able to download both sheets of ballot, had to enlarge with printer but no instructions as to what to do with second sheet. I didn’t find out until I sent ballot (UPS) I was to fold other paper into envelope and insert ballot. I merely folded cover sheet (?) around ballot and put in mailing envelope. UPS enclosed ballot in their envelope. I’m not sure if my ballot was considered valid. It cost me $49.Cdn to send overnight 2 weeks before election. NY state was “Blue” hoped my ballot counted.”
Another Overseas Absentee Voter did manage to vote, but indicated that “most of [her] American friends” had not been able to do so:
“i sent my registration by mail, which was never received. took me about a month of multiple emails to find out that it was never received. i then waiting for registration via email. i never got that as well! had to write multiple emails for someone to email it again. was difficult getting humans to respond and understand my simple issues. i was passed from one person to the next, to the next. the only way i got a response was by sending emails with 7-8 reps CC'd- hoping that one of them would answer! took weeks to get basic responses. the embassy is useless. most of my american friends did not vote here cause they make it so difficult and non-user friendly.”
Others referred back to the problems of paper size and envelopes within envelopes:
“By the time I decided and figured out the envelopes I was certain my ballot would not arrive on time.”
Politics and Political Processes
There was high interest in U.S. politics across all voter types (see figure 9), including Non-Voters (see Figure 8). The lowest rate of “extremely interested” was a relatively high 46.0% among Polling Place Voters, with the highest rate of “extremely interested” among Overseas Absentee Voters, at 62.2%. Over half (53.0%) of Domestic Absentee Voters expressed extremely high interest in U.S. Politics.

Turning to looking at respondents’ concern about other countries interfering in the 2024 U.S. General Election (see Figure 10), the highest rates of concern were among Overseas Absentee Voters (42.1% extremely worried), and the lowest rate of concern was among Non-Voters (30.2%). Overall, over one-third of respondents noted that they are extremely worried.

The last question respondents were asked was how they felt the United States rates in the eyes of the world (see Figure 11).
Interestingly, although offered a neutral option, the majority took a clear stance. Just over one-third (34.5%) responded either “extremely favorably” or “moderately favorably.” Non-Voters and Overseas Absentee Voter respondents were least likely to respond “extremely favorably” and “moderately favorably,” at 28.4% and 33.1%, respectively.
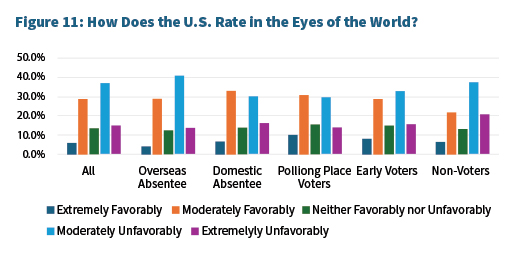
Table 17 presents the percentage of respondents, by racial identity, responding “extremely interested” or “strongly agree” to a series of questions or statements. There is notable variation by racial identity for the statement, “We should always be allowed to vote by mail,” the question, “In general, how do you think the United States rates in the eyes of the world?” and the statement, “We should have automatic voter registration.”

Opinions on Possible Voting Reform
Respondents reported their opinions on a number of different scenarios for potential voting reforms.
Given the challenges around ballot return for both Domestic Absentee Voters and for Overseas Absentee Voters, one might expect support for internet or email voting among these respondents (see Figure 12). When asked to rank their agreement with the statement, “We should have internet or email voting and ignore the risks,” with the phrase “ignore the risks” added to the question to ensure that respondents were aware there is a debate around the question of security, among those who would most benefit, there was 45.3% agreement (Overseas Absentee Voters) and 44.7% (Non-Voters). Among those for whom such a policy would be less beneficial, there was less support: 11.4% (Early Voters) and 10.3% (Polling Place Voters).

Respondents also gave their opinion on the opposite side of the coin: support for only paper ballots with a verifiable paper trail (see Figure 13). As might be expected, the results were correlated inversely with the question about internet voting: Non-Voters and Overseas Absentee Voters offered less support for such a policy, while Polling Place Voters and Early Voters offered more.

U.S.-based respondents offered their opinion on automatic voter registration (see figure 14), with 60% of Non-Voters indicating strong agreement, while there was less support among both Polling Place Voters and Early Voters.

U.S.-based respondents shared their thoughts on whether they should always be allowed to vote by mail (see Figure 15). Strong support emerged for the policy among those it would directly affect: Domestic Absentee Voters (80.1%) and Non-Voters (70.0%).

Four statements on which Overseas Voters were asked to express their opinion (see Figure 16) sought to explore scenarios related specifically to U.S. citizens residing and voting from abroad.
These statements were:
A: All US citizens born abroad should have the right to vote in federal elections.
B: There should be an option for U.S. voters indefinitely abroad to opt into permanent overseas absentee voter status
C: There should be standardized deadlines across all states for voters living abroad.
D: Information should be included in each U.S. passport about voting rights and procedures for U.S. citizens living abroad.

Over 70 percent (71.1%) of Overseas Absentee Voter respondents strongly agreed that all U.S. citizens born abroad should have the right to vote in federal elections. The right for U.S. citizens born abroad to vote in federal elections is not codified in the Uniform and Overseas Citizens Absentee Voting Act and is therefore left to the states to decide. Twelve states do not currently allow U.S. citizens born abroad to U.S. parent/s to use their U.S. parents’ voting residence address in order to vote in U.S. federal elections.
Overseas Absentee Voters also voiced support for permanent overseas absentee voter status, given the challenges that they have noted about difficulties with the registration process, and the requirement to register again each calendar year there are elections in which they want to vote. Over half (56.4%) strongly agreed.
One of the many challenges Overseas Absentee Voter respondents noted was the confusion around deadlines. They might have a ballot return deadline on Election Day, while their friend from another state has a ballot return deadline the week after Election Day. Just over one-third (36.9%) strongly agreed that there should be standardized deadlines across states.
Finally, Overseas Absentee respondents indicated their thoughts on whether there should be information in each U.S. passport regarding voting. There is currently information in each U.S. passport concerning the requirement to file taxes. Just under one-third (29.8%) strongly agreed.
Conclusion
In the final question to the survey, respondents indicated how they would cast their ballot in the 2028 General Election.
As noted above, over ten percent of respondents were not able to cast a ballot in the 2024 General Election, yet the majority of those expressed their intention to vote in 2028 (see Table 18). Their interest in the U.S. political system remains strong.

This 2024 Voter Experience Survey has shown that voters remain engaged, interested in U.S. politics, and dedicated to the civic duty of voting. Yet the complexity of the U.S. voting system, and the fact that federal elections are administered on the state level, can lead to confusion and disenfranchisement. Voters would benefit from additional information, clear instructions, and streamlined procedures.